Simplifying Averages Problems - Underlying Principle and Application
Whenever someone studies any area of Mathematics, they should be clear about the basic understanding of the same. The same thing is also applicable for Averages Problems. Whenever in a class, I’ve asked my students “What is average?”, most of the replies came as “Total divided by number of items”. Although, this is correct at most of the instances, this is not how one should understand the meaning of Average.
In order to simplify Averages Problems, one should firstly understand the basics of the same. Average (or the average number) is a unique value which can replace all the different values (which may be distinct to each other) such that the main idea in the context doesn’t change. Now, usually the “main idea in the context” is the Total. Hence, the above formula works, which is usually answered by students.
In this article, we will not learn how to understand the basics behind this, but we will also tackle how to quickly calculate when it comes to Averages Problems in aptitude exams. Let’s look at few Averages Problems and Solutions (rather approach and thinking behind them).
Problem 1
For instance, if there is a particular set of students in a class, who have scored the following set of marks:
- 5 students scored 65 marks
- 10 students scored 75 marks
- 5 students scored 90 marks
Now suppose we are asked for what should be the average marks obtained by the students in the class. What the question is actually looking for is what unique (single) marks can replace each of the different marks, such that the total marks of the 20 students in the class is undisturbed.
A Quick glance at the Solution
Although, we can find the total and calculate the average, let us look at an alternate way to solve this problem. Check the image attached.
Few things to note:
- The table need not be drawn, we can do that part mentally.
- The assumed average could be any value of our choice. We just assumed it to be 75, because it’s a value in the middle of the data set and the offsets (or deviations) from this number can be calculated
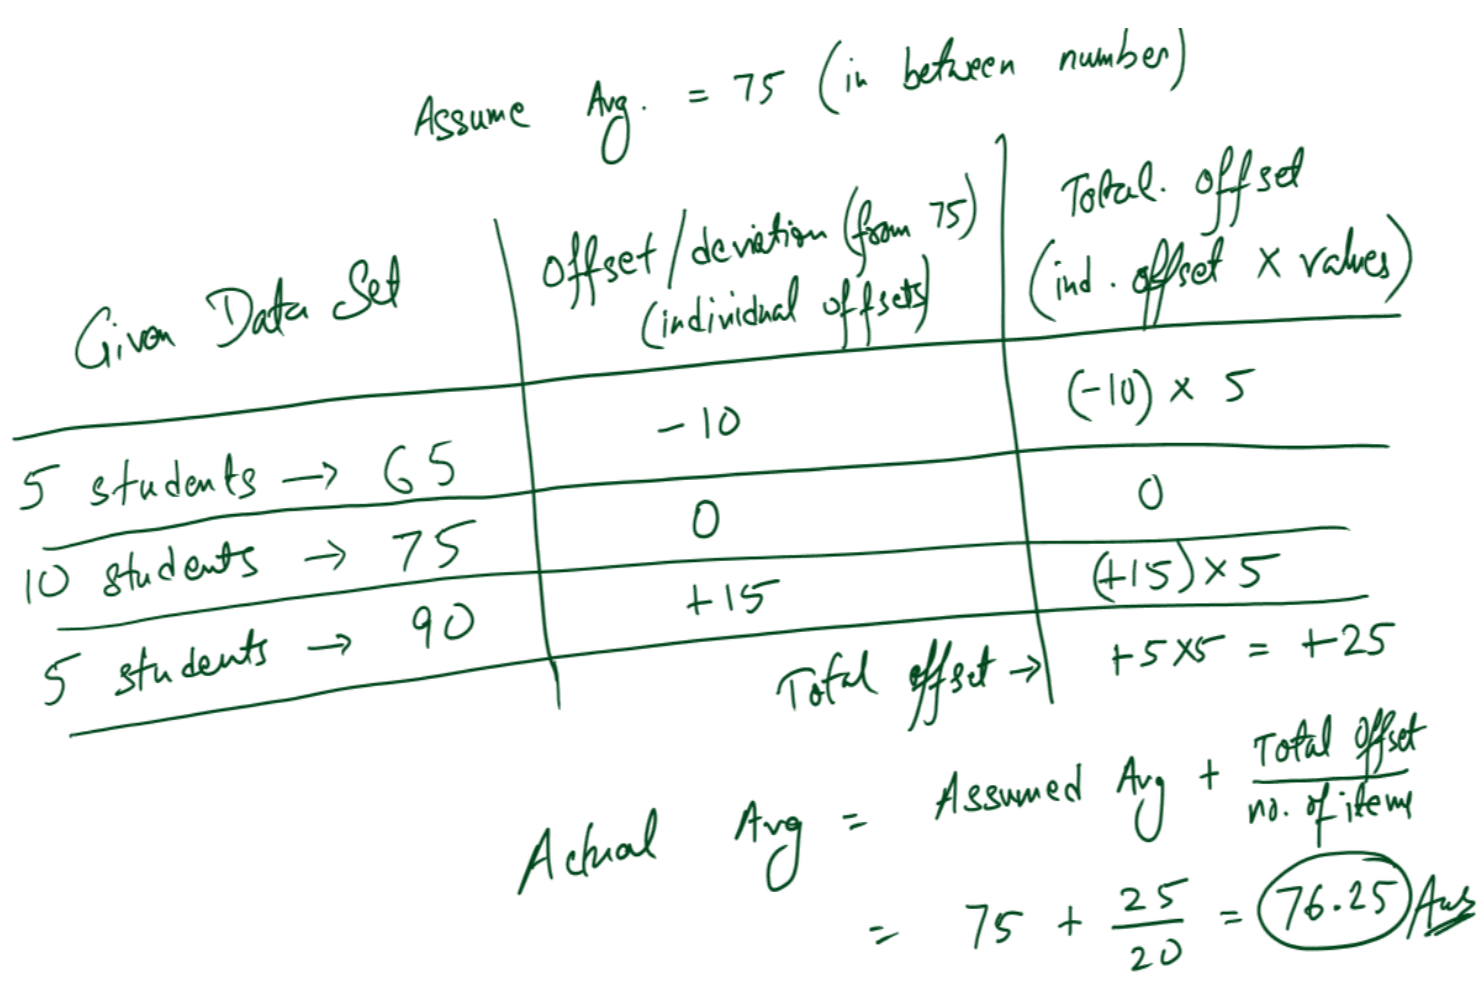
Now, once we understand the basic principle of average, it should be easy to understand why this idea worked in this solution. We needed to replace the different values (65, 75, 90) with a unique value which could best represent the data-set. We tried to distribute a randomly chosen value, i.e. 75, within the data-set. But, we find that there is still a (+25) left to be distributed among the 20 values. This can be ditributed as (+25/20 =) +1.25 to each value. Once we do that, our net distribution should be 75 + 1.25 = 76.25, which should be the final answer.
We would come back to an important point that we raised at the starting of this article. The point was, the main idea in the context might change. It may not be simply the “Total” always.
Let’s understand this idea with another problem of a different type:
Problem 2
The population of a certain colony of ant grew by 20% in the first year, by 66.66% in the second year and by 300% in the third year. Find the average percentage growth rate per year for these three years.
Now, in this question if we simply take the average in the following manner (20 + 66.66 + 300)/3 and claim our final answer as (roughly) 128.88%, we will be completely wrong. Let’s understand why so.
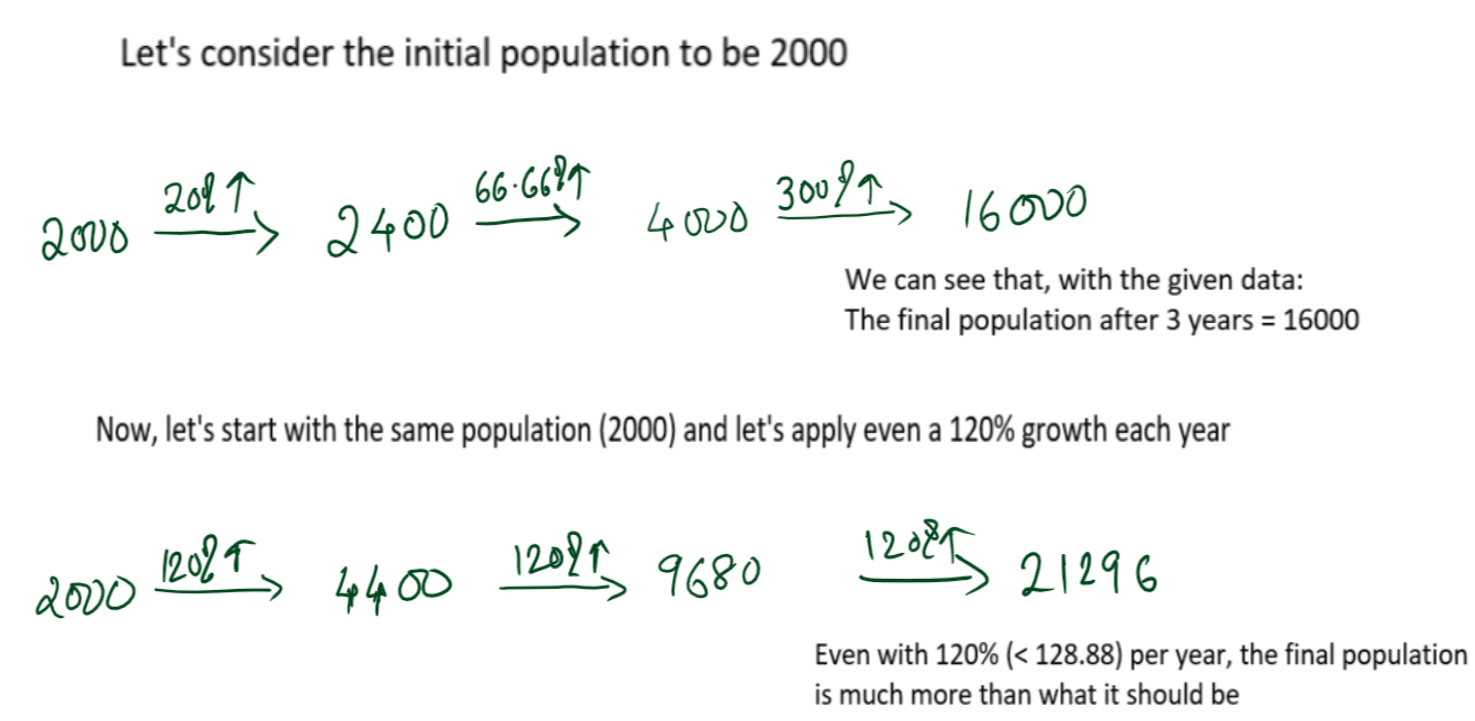
Proof of inaccuracy behind the approach
As we can see, even if we consider the per year growth to be 120% (which is less than the 128.88% that we achieved), our population grows far more in the 3 years than what it should be (using the given percentage changes)
The Correct Approach (Step-by-Step Solution)
Step 1: Understand the primary idea behind it.
In this problem, we have the growth percentage calculated as a percentage on the previous year population. Not all percentages are applicable on the first year population.
Step 2: Remember the basic principle of Averages.
We need to replace each of the different percentage values (20, 66.66, 300) by a single percentage value (say r%), such that the overall idea doesn’t change. In this case, the overall idea should be “the same growth in population for 3 years”. In the image, alongside, we have explained the solution.
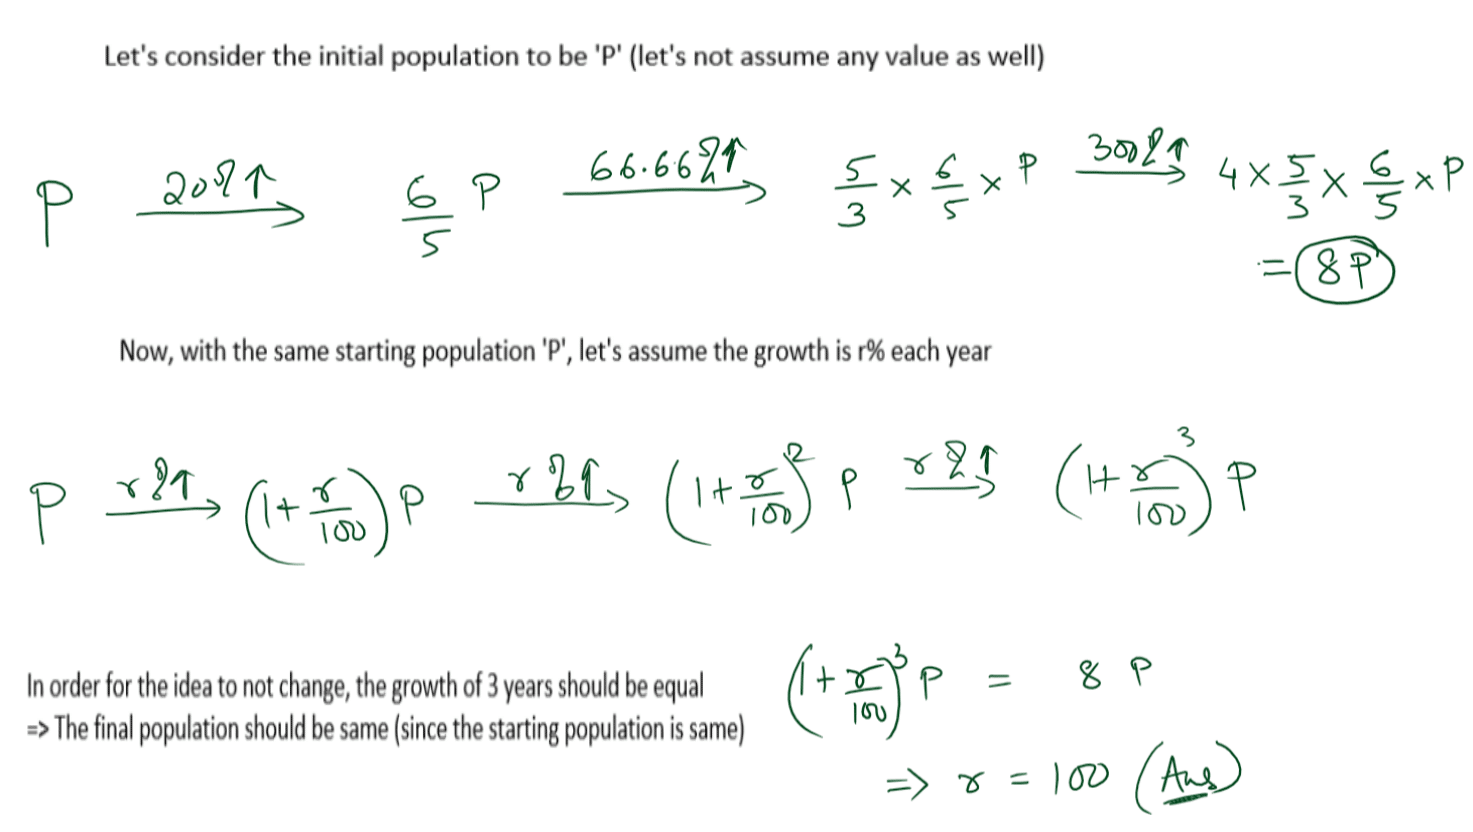
As it should be now evident from the solution, the actual answer should be 100%. You can apply the same values (or any value of your choice) and verify whether 100% growth leads to the same answer or not (as we did earlier with 120%)
The understanding of offsets (or deviations) is useful from calculation point of view as well. It saves a lot of time and since you are calculating less, leads to an accurate answer as well. The following video explains this with a problem explained. Pause the video at the start, if u wish to read the question and try it out yourself, before looking at the solution.
Watch a Video from our classes on this topic
Check the Videos Section in our website to watch more videos of our courses.
You can click here to Subscribe to our YouTube Channel to watch more videos on all topics tested in Aptitude tests.